The Straight Line to the Green Box: Working Out What Your Broadband Can Actually Do
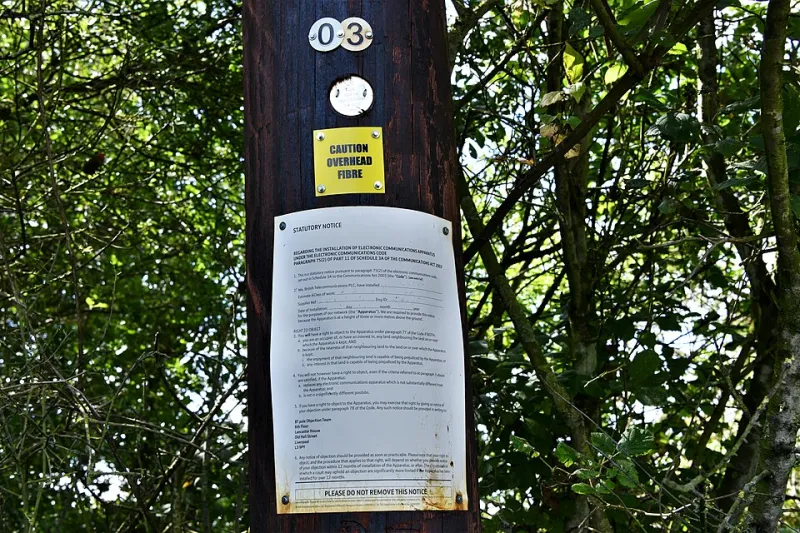
Photo: Michael Garlick , CC BY-SA 2.0, via Wikimedia Commons
Walk down almost any residential street in the UK and you will pass one: a green cabinet, sometimes grey, often tagged with a sticker and a faint smell of wet pavement. We treat it as invisible furniture. Yet for many homes still served by copper into the premises, that cabinet is the mathematical origin of your broadband speed.
Not the exchange, not the router's flashing lights, not the number on the sales page. The cabinet. The further your line runs from it, the more the signal fades, and the lower your realistic speed tends to be. That relationship is not a mystery. It is a straight line with a bit of city noise around the edges.
The green box is the origin
Imagine a simplified model. Let d be the copper distance from the cabinet to your master socket, measured in metres. Let S be your line's sync speed in megabits per second. A rough linear model looks like this:
S = a - bd
Here a is the speed you might see very close to the cabinet, and b is the rate at which speed falls away with distance. The exact numbers vary by network, cable gauge, joints, and a hundred small realities of the street. But the shape is the point: distance is the variable, speed is the output, and the graph slopes downwards.
This is why two neighbours on the same package can get different results. One might be 180 metres from the cabinet along the copper path; another might be 900 metres away, with the line looping round a junction box and through a few aged connections. Same advert, same router, different value of d.
Fibre-to-the-premises changes the model entirely, because light behaves differently over the fibre. But plenty of UK homes in 2026 still rely on part-copper connections, and even full-fibre installs can involve internal wiring, extension sockets, and router placement. The algebra of distance has not vanished. It has just moved.
Reading your router like a map
Your router is holding useful clues. Log in to its admin page and look for line statistics: sync speed, attenuation, noise margin, and error counts. Attenuation is the one that behaves most like a distance meter. It is measured in decibels, and higher numbers generally mean a longer or lossier line.
You do not need to turn into a telecoms engineer. Use the figures as a sanity check. If your package advertises an average speed of, say, 67 Mbps but your router syncs at 38 Mbps and reports high attenuation, the gap is not necessarily a fault. It may be the straight line doing its work.
A simple audit looks like this:
- Find your cabinet if you can. Your ISP's availability checker sometimes shows the technology and estimated speed range.
- Note your sync speed and attenuation from the router.
- Compare your result with the estimated range for your address, not the headline 'up to' figure.
- Test at different times of day, using a wired connection where possible.
- Keep a short log if you need to raise a fault.
The important distinction is between line rate and delivered speed. Your line rate is what the router negotiates with the cabinet. Delivered speed is what survives Wi-Fi, contention, and whatever else is happening on the network. They are related, but they are not the same number.
Contention is an inequality, not a promise
Now add the shared part. Domestic broadband is not a private pipe from the cabinet to your sofa. Capacity is shared, especially at peak times. If C is the capacity available to your street segment and n is the number of active users pulling on it, then a very crude fair-share ceiling is:
S_delivered ≤ C / n
At the same time, your delivered speed cannot exceed your line rate:
S_delivered ≤ S_line
Put those together and you have a small system of inequalities:
S_delivered ≤ min(S_line, C / n)
That is the algebra of a busy evening. Your line might be capable of 55 Mbps, but if the shared capacity per active user drops to 30 Mbps at 8pm, the second ceiling wins. The graph is not broken. It is being clipped by a different constraint.
This is also why 'guaranteed minimum speed' matters more than the top-line number. Under the UK's voluntary code for broadband speeds, providers give customers a minimum guaranteed speed at the point of sale. If the service falls below that and is not fixed within the allowed window, you may have a route to exit or compensation. The inequality to watch is not 'am I getting the maximum?' but 'am I staying above the floor I was promised?'
What the straight line is good for
The point is not to reduce your broadband to a single equation and declare the case closed. Real streets are messier than that. Trees, extension leads, old aluminium cable, a router behind a fish tank, a neighbour running a server: all of it adds noise.
The point is to give you a better question. Instead of asking 'why is my broadband slow?', ask 'how far am I from the cabinet, what is my line doing, and what is the shared ceiling at peak time?' That is a consumer maths question, and it is answerable.
When you renew your package, use the model. Check the estimated range for your address. Ask about the guaranteed minimum speed. Find out whether full fibre is available. And if the green cabinet is at the end of your street, remember that it is not just a box. It is the origin point of a graph you are already living on.