The Weighted Score Behind the Roadworks: Who Decides Which Pothole Wins
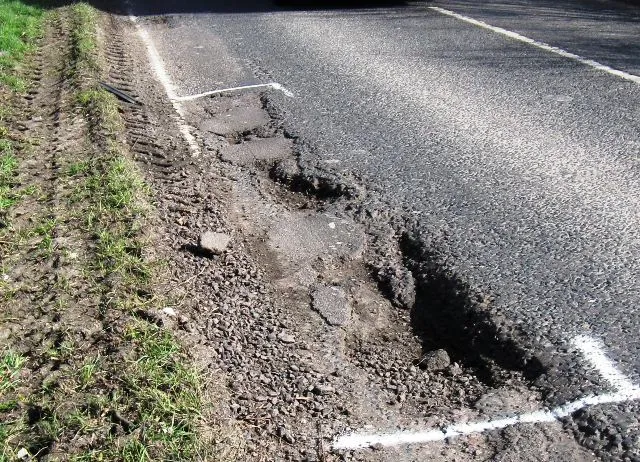
Photo: Chris Reynolds, CC BY-SA 2.0, via Wikimedia Commons
Imagine a city council with 4,800 potholes on its list and £2.1m to spend this year. The engineer at the depot cannot fix them all. So how does one street get resurfaced while another gets a chalk circle and a promise? The answer is often a weighted score: a small linear model with coefficients chosen by humans. It looks technical. It is also a set of priorities in disguise.
Meet the fictional backlog
Let’s invent Middlemarsh City Council. It has a backlog of 4,800 defects. Each defect i has a few variables:
- d = depth in millimetres
- v = traffic volume in vehicles per day
- h = hazard rating from 1 to 5, based on a visual inspection
- s = 1 if the defect is on a school route, 0 otherwise
- c = number of complaints logged
- k = repair cost in pounds
The council publishes a priority score:
S = 0.45d + 0.25(v ÷ 1000) + 1.2h + 1.5s + 0.05c
That is a linear scoring model. Each variable is multiplied by a coefficient, and the results are added. A 1mm increase in depth adds 0.45 to the score. A school-route flag adds 1.5. A thousand extra vehicles per day adds 0.25. The coefficients are not natural constants. They are policy choices wearing a lab coat.
Step 1: define the variables
The first job is to decide what counts. Is depth measured at the deepest point or the average? Is traffic volume a daily average or a peak-hour figure? Does a school route mean the road is directly outside a school, or on a walking route? Each definition changes the score. A council can make a pothole appear urgent or moderate simply by choosing the variable definition.
This is not a conspiracy theory. It is data design. But it is why asking for the formula is not enough. You also need the definitions, the inspection dates and the missing-data rules. A defect with no traffic count is not necessarily low priority; it may just be unmeasured.
Step 2: read the coefficients as priorities
The coefficients are where the politics lives. If the depth coefficient rises from 0.45 to 0.90, deep potholes jump the queue. If the school-route coefficient rises from 1.5 to 3.0, safety near schools outweighs traffic volume. If the complaints coefficient rises, loud streets win. None of those choices is automatically wrong. They are trade-offs. The question is whether the council has explained them.
A linear score is easy to audit because it is transparent. You can check the arithmetic. But transparency is not the same as fairness. A formula can be perfectly published and still produce a result that feels wrong, because the weights reflect a set of values you may not share.
Step 3: apply the budget constraint
Now add the money. Let B be the repair budget, say £2.1m. Let x_i be 1 if defect i is fixed and 0 if not. The budget constraint is:
Σ k_i x_i ≤ B
There is also a crew-hours constraint:
Σ t_i x_i ≤ H
where t_i is the time needed for repair i and H is the available hours. And there are legal or policy constraints. For example, a defect with depth at least 40mm and hazard rating at least 4 might have to be made safe within 24 hours. In algebra, that is x_i = 1 for those defects. The council cannot trade them away for cheaper work elsewhere.
These are inequalities, not equations. The budget does not have to be spent exactly. The crew hours do not have to be used exactly. The model is a set of limits, and the council chooses a feasible set of repairs inside them.
Step 4: ranking is not the same as optimising
Most councils rank defects by score and work down the list until the budget runs out. That is a greedy algorithm. It is simple and defensible. But it is not always the best use of the budget.
Take three potholes. A scores 80 and costs £4,000. B scores 60 and costs £1,000. C scores 55 and costs £1,000. With a budget of £2,000, the greedy list starts with A, cannot afford it, then picks B and C. Total score: 115. That is fine. But if the budget were £4,000, greedy picks A alone for 80, while B plus C plus another £1,000 repair might beat it. The ranking is not the same as the optimal portfolio.
Linear programming asks a different question: choose x_i to maximise Σ S_i x_i subject to the budget and crew constraints. That is a knapsack problem, and it can produce a different list from a simple ranking. In practice, councils often blend the two: a ranked list, an engineering review, and a budget check. The maths does not replace judgement. It makes the judgement visible.
The fairness question
Here is where you come in. The weighted score is a local accountability tool. Ask your council:
- What are the weights?
- What are the thresholds?
- How is traffic volume measured?
- Does the complaints coefficient advantage streets with more time to complain?
- Is there a sensitivity analysis? If the weights change by 10%, does my street move above or below the cut-off?
The cut-off is the key inequality. If the last funded repair has a score of S*, then any defect with S < S* is outside the funded set this year, unless the constraints change. That is the line between fixed and forgotten. It is not a moral line. It is a budget line.
Score your own street
You can build a rough version at home. Pick a defect on your street. Estimate depth in millimetres, traffic volume, hazard rating, whether it is on a school route, and how many complaints you know about. Use the council’s weights if they publish them, or make your own. Then compare your score with the council’s funded list. If your street scores high but is not fixed, ask why. The answer might be budget, crew hours, a missing inspection, or a weight you disagree with.
That is the hidden algebra of pothole priority. It is not glamorous. It is a sum of weighted variables and a set of inequalities. But it decides which streets get smoothed and which get bumped over for another winter. If the formula is fair, publish it. If it is not, change the weights. Either way, do the arithmetic.